 Survey results indicate that, alongside socio-economic development, the traditional cultures of ethnic minority groups are being preserved and fostered. Pictured here is a dance performance during the Cham people’s Ka-te festival
Firstly, regarding population, as of July 1st, 2024, the total ethnic minority population nationwide stood at 14,443,086, with males accounting for 50.3% and females for 49.7%. Compared to the second survey (conducted on April 1st, 2019), a span of five years, the ethnic minority population has increased by 323,830 people. 85.7% of ethnic minority individuals reside in rural areas.
The ethnic minority groups with the largest populations exceeding one million people are, in order: Thai, Tay, Mong, Muong, Khmer and Nung. There are 15 ethnic groups with populations of fewer than 10,000 people, comprising: Phu La, Lu, Lo Lo, Chut, Mang, Pa Then, Co Lao, Cong, Bo Y, Si La, Pu Peo, Brau, O Du, Ro Mam and Ngai.
Five ethnic minority groups have a population of fewer than 1,000 people (unchanged from the second survey), with specific population sizes as follows: Si La (808 people), Pu Peo (714 people), Brau (459 people), O Du (624 people), and Ro Mam (591 people). In this census, the Brau are the ethnic group with the smallest population; in the previous census, the O Du had the smallest population.
The Northern Midlands and Mountains region is the primary home of ethnic minority groups, accounting for 50.5% of the total ethnic minority population, equivalent to over 7.3 million people. The Central Highlands is another region with a large concentration of ethnic minorities, home to nearly 2.4 million people and representing 16.4% of the total.
About religion, survey results indicate that as of July 1st, 2024, 18% of ethnic minority individuals, equivalent to 2,571,170 people, practiced a religion, an increase of 245,720 compared to 2019; this growth demonstrates that the right to freedom of religion in Vietnam generally and within ethnic minority communities specifically, is consistently respected and guaranteed by the State.
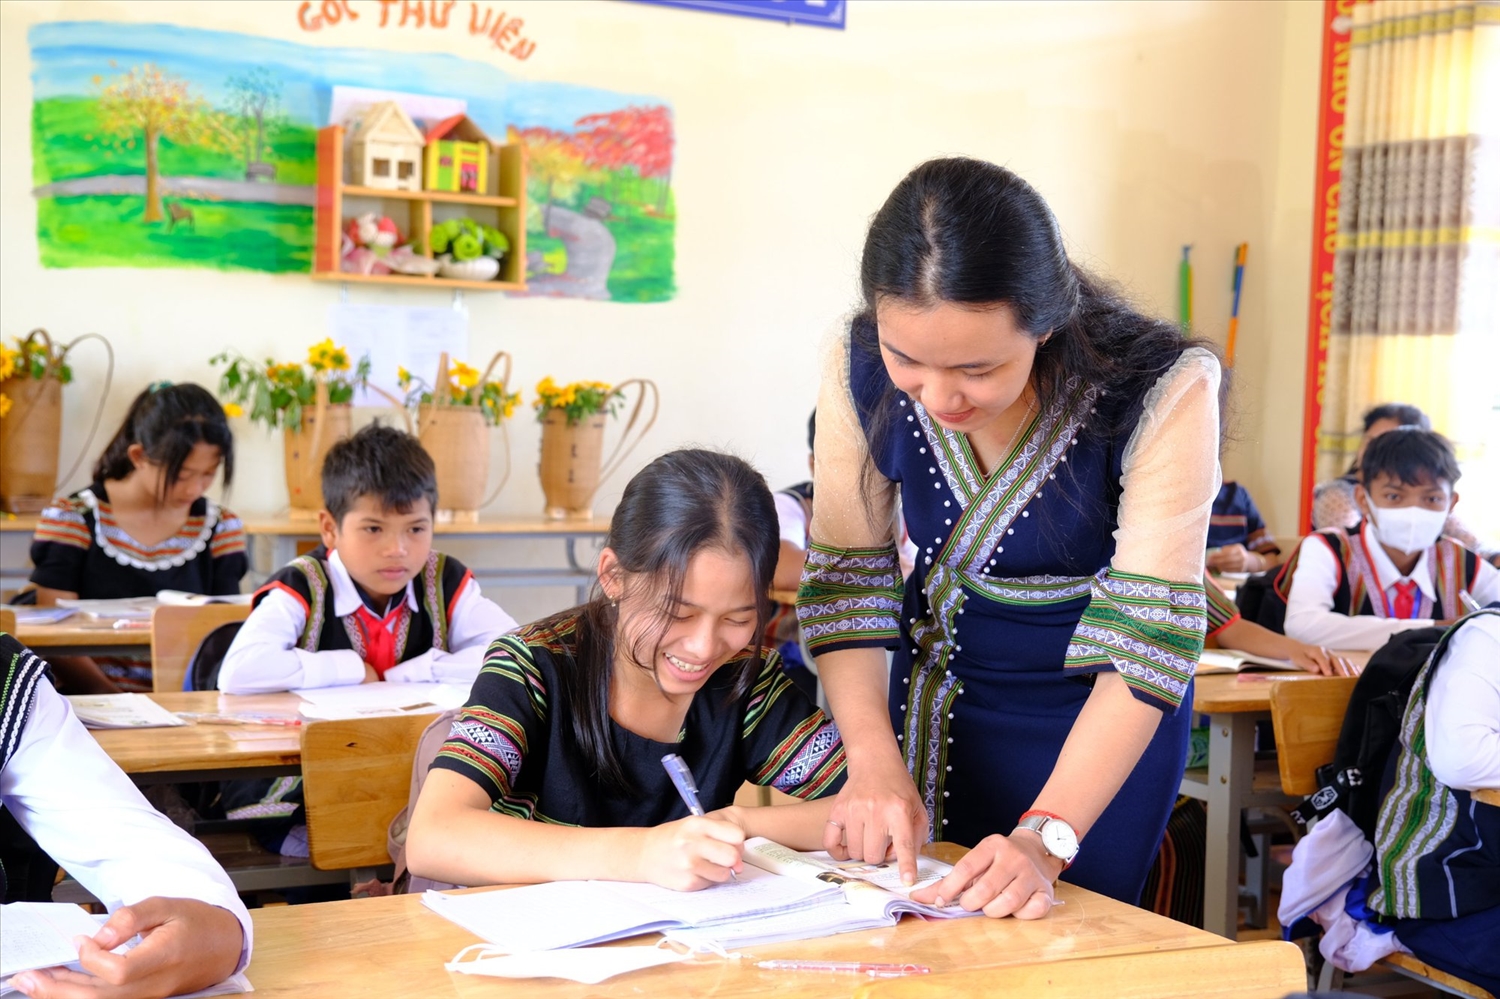 Thanks to State investment policies, education in ethnic minority areas has achieved comprehensive development
Survey results also indicate significant changes in the socio-economic landscape of the 53 ethnic minority groups. Most notably, the living amenities of ethnic minority households continue to improve. Many households now have the means to access cultural and social information as well as information technology; among these, televisions are the most common household appliance, owned by 69% of households. The proportion of ethnic minority households owning mobile or landline phones reached 96.4%, an increase of 3.9% compared to 2019; the proportion owning computers (desktops, laptops or tablets) reached 13.8%, an increase of 3.5%. There has been a significant increase in the use of other household appliances by ethnic minority households. The sharpest increases were seen in the percentage of households using refrigerators (reaching 73.3%, up 18.8%) and air conditioners (reaching 17%, up 10.4%). The majority of ethnic minority households (89.3%) use motorized vehicles (motorcycles or motorbikes), while 4.3% use automobiles, an increase of 2.3%.
The proportion of ethnic minority households with home Internet access has reached 85.6%, a significant increase from 61.3% in 2019, thereby increasingly expanding their access to information. The proportion of ethnic minority households connected to the national power grid reached 99% (up from 96.7% in 2019); access to hygienic water sources reached 92.8% (an increase of 4.2%); and the use of hygienic latrines reached 79.6% (up from 59.6% in 2019), demonstrating that sanitary conditions for these communities continue to improve significantly. Notably, the proportion of households keeping livestock or poultry beneath or immediately adjacent to their homes continued to decline by 3.1% compared to 2019, falling to 21.3%. Keeping livestock or poultry under or right next to the house is common in ethnic minority areas due to the social characteristics and customs of these ethnic groups. Reducing this rate reflects a significant shift in awareness regarding the need to change a lifestyle that is negatively affecting the health and quality of life of the people.
Many other indicators serve as bright spots in the socio-economic landscape of ethnic minority communities. Regarding housing, 95.2% of ethnic minority households own their own homes; in border areas, this figure stands at 98.3%. The vast majority of ethnic minority households possess solid or semi-solid housing. In 2024, the rate of ethnic minority individuals holding health insurance cards reached 92%, with 31.6% using them to access medical examination and treatment services. Significant progress has been made in education: primary school enrollment among ethnic minority groups reached 103.2% (up 2.7%); lower secondary enrollment was 91.2% (up 5.4%); and upper secondary enrollment stood at 53.8% (up 3.1%) compared to 2019...
While not exhaustive, these figures demonstrate the efforts of the Party, the State, and various levels and sectors in enacting and implementing policies regarding ethnic minorities and religion; these efforts, combined with the proactive drive of the people themselves, have contributed to transforming the socio-economic landscape of ethnic minority regions. Reliable data from the survey also contribute to evaluating the effectiveness of ethnic minority policies and guiding development in ethnic minority areas through to 2030./.
